

The short answer is that citywide vacancy does not pay a property’s bills. Houston retail space is tight overall, but a center can still struggle if the trade area is weak, access is awkward, the tenant mix is fragile or the cost to replace a tenant is too high. In this market, the gap between a good property and an average one matters more than the headline.
The report behind this article is CoStar’s Houston Retail Market Report dated October 4, 2026. I use it as a market framework—not as a valuation for any individual property. Retail data can change materially by property type, geography and methodology, so I do not mix numbers from different reports as if they were one continuous series.
What the 5.4% vacancy rate means in plain English
Houston retail vacancy was 5.4% across roughly 442.8 million square feet of inventory. In other words, about 95 out of every 100 square feet was occupied. The market also recorded 1.1 million square feet of net absorption over 12 months. Net absorption simply means that newly occupied space exceeded space returned to the market by 1.1 million square feet.
Average asking rent was $24.95 per square foot, with 1.0% annual growth. Asking rent is the advertised starting point, not necessarily the rent a landlord finally collects after free rent, build-out money and commissions. Another 5.13 million square feet was under construction—only 1.2% of existing inventory—and 74.3% of that space already had tenants committed.
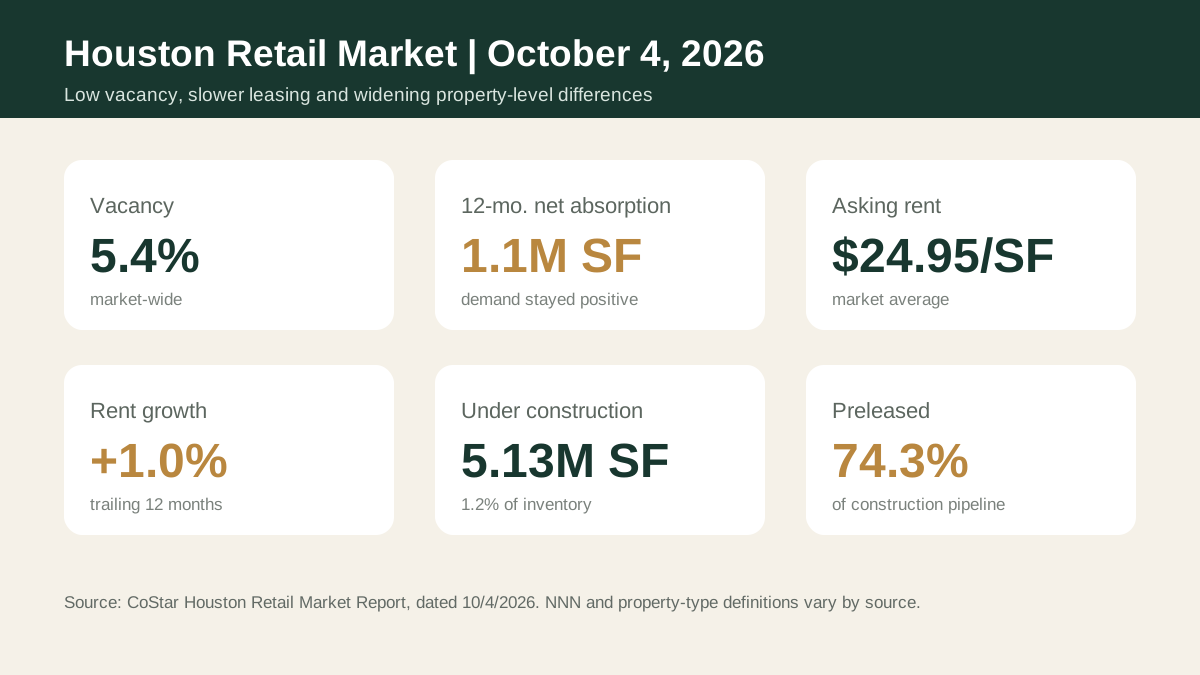
Those numbers do not describe an oversupplied market. They do show a market that has slowed. Leasing through the first three quarters was under 6 million square feet—the weakest pace since 2020—and the average lease was about 15% smaller than before the pandemic. Spaces under 3,000 square feet accounted for roughly three quarters of leasing activity.
The national consumer backdrop is not collapsing either. The U.S. Census Bureau reported that August 2026 retail and food-service sales were up 6.0% from a year earlier, but that figure is not adjusted for inflation. At the same time, the Federal Reserve Bank of Dallas described Houston’s economy as expanding moderately while business input costs were rising. Sales can grow while tenant margins remain under pressure.
The gap is widening between strong and weak properties
The most important part of the report is not the 5.4% average. It is the spread underneath it. Large shopping clusters anchored by big-box stores had only 2.8% vacancy. Smaller neighborhood centers and rows of storefronts were both at 7.9%. In those two categories, roughly 9% of the space was actively being marketed, and more space was vacated than newly occupied during the quarter.
Location shows the same split. Prime areas around Uptown and the Inner Loop had availability near 3%, while older corridors such as FM 1960/I-45 and Westchase were closer to 10%. More than half of the market’s 26.5 million square feet of available space was built before 1990. The report also found that centers completed in the past five years leased vacant space in less than five months on average, compared with roughly nine months for properties built before 1980.
This is why “Houston retail is tight” is not enough underwriting. A tenant choosing between two spaces is looking at visibility, access, parking, neighboring businesses, signage, condition and the cash required to open—not the metro vacancy rate.
Where demand is going
Fitness, entertainment and indoor recreation represented about one-third of recent leasing. Grocery, fitness and entertainment users are also taking selected former big-box spaces. Meanwhile, Montgomery County, Katy and Bridgeland produced nearly 80% of metro absorption over the past year and about half of deliveries. Retail is still following rooftops, but the strongest suburban growth nodes are not interchangeable with every outer-ring location.
A growing population helps only when the property captures the right daily traffic. I would rather see a credible five- and ten-minute trade area, convenient access from the correct side of the road and compatible neighboring tenants than rely on a broad county growth forecast.
The rent is only the beginning of the lease economics
The report placed average NNN asking rent near $25 per square foot. Prime pad sites can exceed $30, small-shop space inside Loop 610 can reach $50 to $70, and newly delivered suburban space may ask $40 to $55. Those numbers are not comparable without understanding size, build-out, expense structure and tenant quality.
The money a landlord contributes toward a tenant’s construction—usually called a tenant-improvement allowance, or TI—is becoming a bigger part of the deal. The report cited roughly $100 to $200 per square foot in new lifestyle centers, around $40 in newer strip centers and $60 to $75 for restaurants. Five-year leases often included one to two months of free rent. If I am buying a center, I want a tenant-by-tenant list of upcoming cash costs, not just a list of rents.
What I would check before buying a Houston retail property
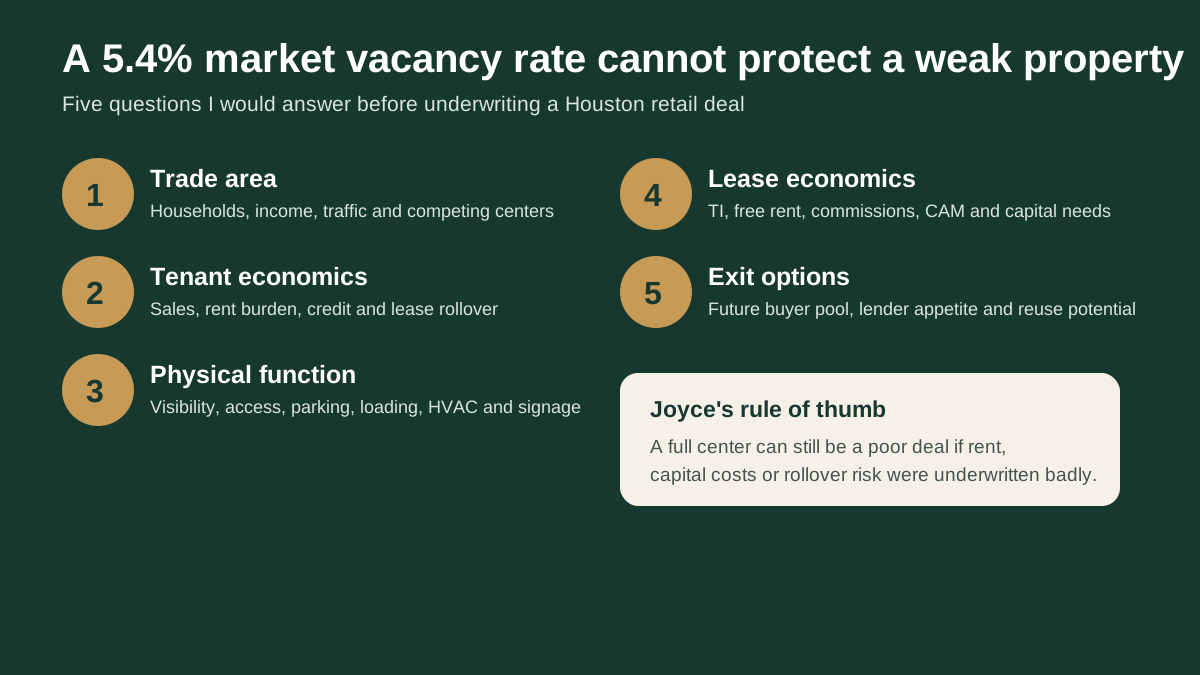
Trade area: households, income, daytime population, traffic counts, access pattern, planned roads and competing centers—not just the city name.
Tenant economics: sales when available, whether the business can comfortably afford the rent, credit, remaining lease term, guarantees and whether several leases expire at the same time.
Physical function: whether drivers can see and enter the center easily, parking, loading, air-conditioning responsibility, roof condition, roadside signs, restaurant plumbing and utility capacity.
Lease economics: base rent, shared operating expenses, free rent, landlord-paid construction, leasing commissions, limits on competing businesses and clauses tied to anchor tenants.
Carrying cost: taxes, insurance, flood exposure, parking-lot work, roof and HVAC reserves, management, legal cost and cash needed during vacancy.
Exit: the likely future buyer, lender requirements, replacement cost and whether the space can be divided or reused when a tenant leaves.
The fastest way to overpay is to treat every dollar of scheduled rent as durable income. I normalize the rent, subtract near-term leasing and capital costs, and stress-test vacancy before I compare cap rates.
A 6.7% cap rate is not an answer by itself
Cap rate is the property’s annual net operating income divided by its purchase price. The report’s trailing-12-month sales sample included 1,861 comparables, with an average cap rate of 6.7% and an average price of $317 per square foot. That is market context, not a price target. The sample mixes single-tenant properties, strip centers, larger centers, different lease lengths and very different tenant credit.
A new quick-service restaurant with a long corporate lease can trade at a much lower cap rate than a multi-tenant center with rollover, deferred maintenance and weak tenants. A higher cap rate may be compensation for risk you cannot see in the marketing package. Rebuild the income instead of borrowing the seller’s cap rate.
How I read the current market
I would describe Houston retail as selective, not weak. Colliers measured 5.8% vacancy in Q2 2026 and reported the first negative quarterly absorption in six years, while Marcus & Millichap’s Q3 commentary also pointed to very soft first-half demand and historically low construction. Those reports use different datasets, but they point in the same direction: the market is not flooded with new space, yet tenants are taking longer and choosing more carefully.
That creates two kinds of opportunity. One is paying a fair price for a strong, functional property where the income is durable. The other is a genuine value-add center where a specific physical or leasing problem can be fixed at a cost the future rent will repay. “Old and cheap” by itself is not a value-add strategy.
Related: Houston industrial real estate opportunity and risk in 2026
Related: What to check before buying commercial property
FAQ
Is Houston retail real estate oversupplied?
Not at the market level. Vacancy was 5.4% and construction equaled about 1.2% of inventory, with 74.3% preleased. The risk is concentrated in specific older centers, corridors and spaces that no longer fit tenant needs.
Are grocery-anchored centers automatically safe?
No. A strong grocer can drive traffic, but the lease, sales performance, co-tenancy clauses, inline-tenant health, access and purchase price still matter. The anchor can help the property without guaranteeing the investment.
Is single-tenant NNN retail easier than a shopping center?
It is often simpler to manage, but the income can depend entirely on one tenant and one lease. Credit, remaining term, rent level, options, building reusability and the cost to release the property are critical.
Sources and scope
Primary source: CoStar Houston Retail Market Report, dated October 4, 2026. Current context: Colliers Houston Retail Market Report Q2 2026; Marcus & Millichap Houston Retail Market Report Q3 2026; Federal Reserve Bank of Dallas Houston Economic Indicators dated September 4, 2026; and U.S. Census Bureau August 2026 retail-sales release. Figures from different sources are not directly comparable when property definitions, geography or methodology differs.
Joyce's Featured Listings

If you want to see what your current budget can buy before comparing commercial and residential opportunities, View Joyce's Featured Listings. This is the website’s general listings page and does not imply that the retail properties discussed in this article are offered there.
Evaluating a Houston retail property?
Send me the address, asking price, rent roll, lease-expiration schedule, operating statement and your expected holding period. I can help organize the real-estate questions and identify which lease, engineering, environmental, financing, tax and legal items need specialist review before you commit.
About Joyce Tang

Joyce Tang is a Greater Houston real estate agent and investor, co-founder of the North American Real Estate Association, founder of JoyHome and JoyNest, and co-leader of the Dr. Wang Real Estate Team.
She has helped more than 200 families buy or sell homes and has participated in more than 40 renovation projects. Her approach examines not only price, but also location, carrying cost, cash flow, risk and future exit options.
Disclaimer: This article is general market commentary, not an appraisal, investment recommendation, legal opinion, tax advice or guarantee of rent, occupancy, appreciation or return. Retail data varies by source and methodology. Commercial buyers should independently verify leases, tenant financials, zoning, environmental conditions, engineering, insurance, taxes and financing with the appropriate licensed professionals.